Quantcast
Channel: esci
Viewing all 81 articles
Browse latest View live

eSci: Fault Networks Capable of Large Quakes Identified Across Central U.S.

$
0
0

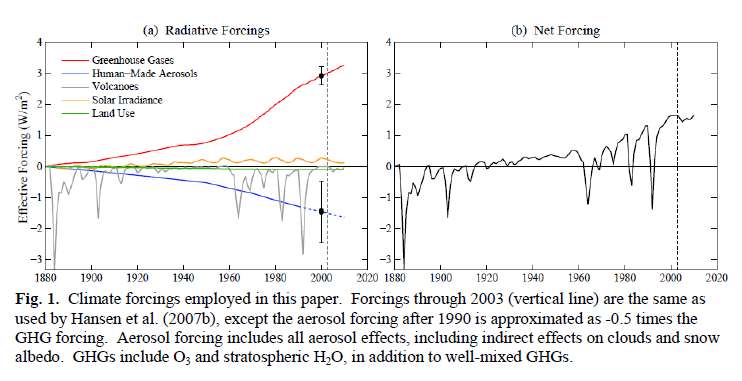
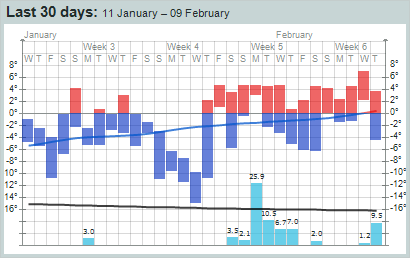
A large area of the midcontinent region of North America may be capable of producing devastating earthquakes like the ones that happened 200 years ago in New Madrid, Missouri according to preliminary results of new studies. A network of ancient, deep faults has been found in the Mississippi river valley south of the New Madrid region. Young sedimentary layers were discovered to have liquified in a manner known to be caused by earthquakes in the southern Mississippi River valley well south of New Madrid.

Buried faults in the U.S. interior extend far outside the New Madrid Seismic Zone
Source: M. BEATRICE MAGNANI, Science, 2012

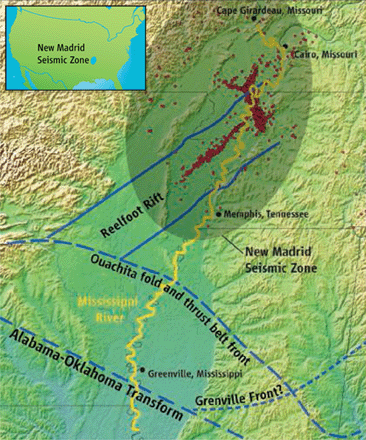
Moreover, an approximately 500 million year old transform fault system, once similar to the San Andreas fault, which runs from Alabama to Oklahoma, shows evidence of some recent reactivation. These ancient structures formed before Africa collided with north America (the ancient continent of Laurentia) to form the Appalachian mountains. Today, these structures are zones of weakness where present day tectonic stress may be relieved.

Recent studies of strain changes around the New Madrid fault zone, which ruptured in a series devastating earthquakes in 1811 and 1812, show very low deformation rates. Therefore, the recurrence period on the faults in the New Madrid region may be much longer than the 500 year recurrence rate now used for risk assessments. The slip on the New Madrid faults may have relieved strain there while increasing stress and strain on fault structures that it interacts with. In the midcontinent region, and in other areas of low rates of continental deformation, earthquake recurrence periods may be thousands of years.

A system of faults, similar to today's Salton Sea rift and San Andreas fault in California, was active about 500 million years ago in what is now the central U.S.

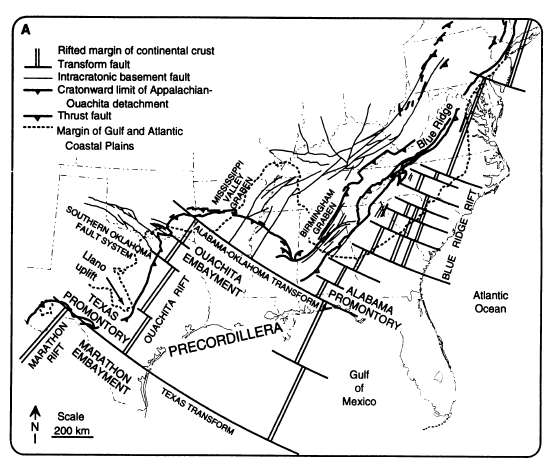
Source: Thomas and Astini, Science, 1996

Although the active boundaries of the north American tectonic plate run through California, Oregon and Washington today, ancient structures like the New Madrid fault zone are capable of relieving stress within the north American plate. The Mississippi valley graben (a down-dropped fault block like the Salton trough) south of New Madrid shows evidence of geologically recent large earthquakes. A long ancient fault, similar to the San Andreas fault, called the Alabama-Oklahoma transform has also shown evidence of relatively recent seismic activity.

Geophysicist M. Beatrice Magnani, of the University of Memphis, Tennessee took marine seismic methods to the Mississippi River, revealing evidence of earthquakes in buried sedimentary layers.

The team found faults with “indistinguishable” profiles both within and outside the New Madrid Seismic Zone, Magnani says. In some places, the warping increases in the older rocks, which are millions of years old. Some faults also deform the young sediments above—evidence of more recent earthquakes and fault movements in the past 10,000 years or so. Higher resolution profiles, only tens of meters deep, show gently folded layers on one fault, hundreds of kilometers south of New Madrid. The folds, Magnani said at the meeting, most likely formed when sediment particles shook like liquid—a phenomenon called liquefaction—during an estimated magnitude-7.6 quake of unknown date.

These profiles suggest that a 500-million-year-old plate boundary south of New Madrid remains active, Magnani says. Other evidence—gathered by Martitia Tuttle, an independent consulting geologist, and others who have dated liquefaction features—suggests that another fault of the same age, which crosses from Alabama into Oklahoma, has had at least three major seismically active periods in the past 10,000 years. But Magnani says her team's new data show that the nearby Ouachita fault remained quiet for reasons still unclear.

Heat flow in the New Madrid region is similar to other fault zones in the central U.S.

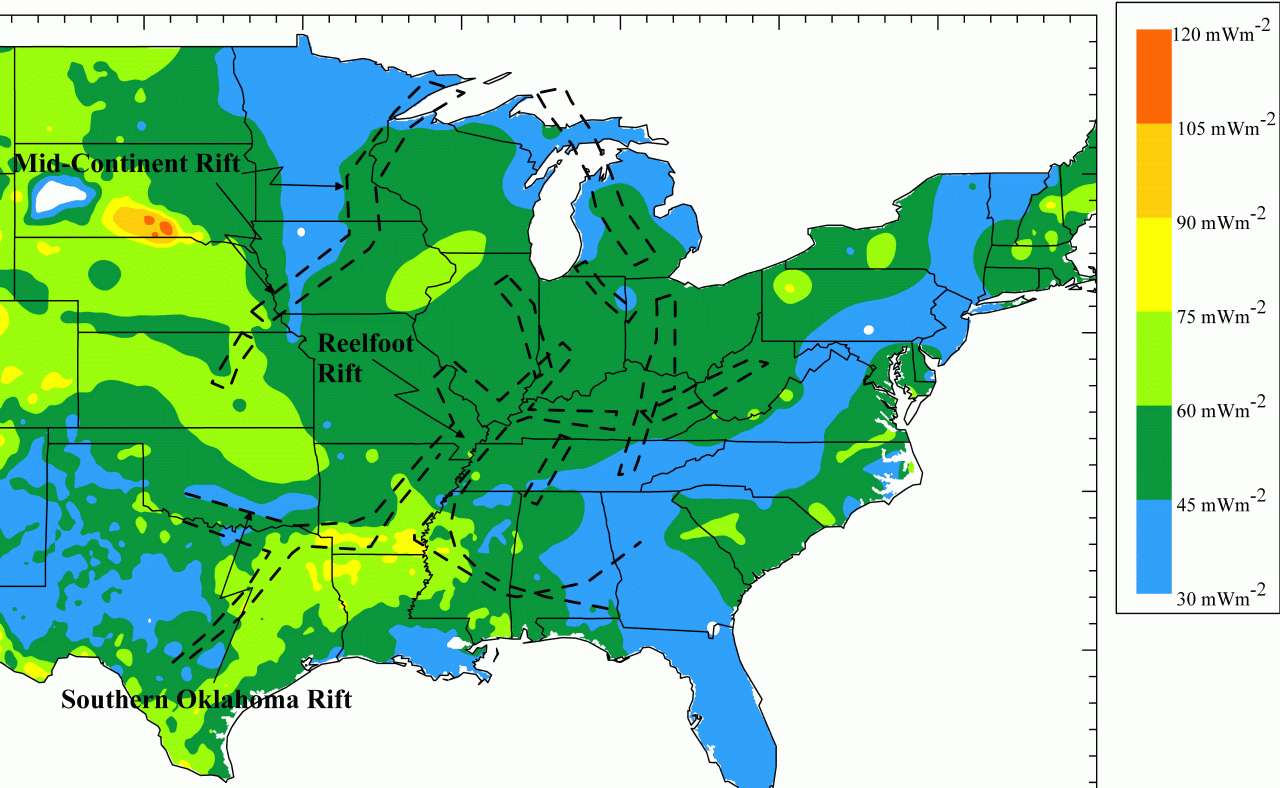
Image source: Seth Stein, Nowthwestern U.

Seth Stein of Northwestern University has observed that GPS measurements of deformation in the New Madrid region show very low strain rates and geologic evidence shows limited amounts of offset along faults. When he saw that recent heat flow studies showed that New Madrid wasn't hotter at depth than other mid-continent fault zones, he concluded that it is no more active than other fault zones. A more active fault zone would generate more heat flow.

 Therefore, Seth Stein concluded that mid-continent fault zones are activated for several seismic cycles, then go quiet after transferring stress to adjacent fault zones. He concluded that a large area of the central U.S. is capable of having large earthquakes, but earthquake recurrence rate may be (many) thousands of years.

The new heat flow results fit into a growing idea that earthquakes can migrate among similar faults, some of which -- such as the Meers fault in Oklahoma -- appear to have been active about 1,000 years ago but show no activity today. Geological studies find that New Madrid earthquakes comparable to those of 1811-1812 occurred about 1450 and 900 AD. However, because this fault system has not generated significant topography, it is likely to have "turned on" relatively recently, perhaps within the past few thousand years.

In this view, prior earthquakes were concentrated on other faults, and future earthquakes will occur somewhere else when the New Madrid system "shuts down." Once this happens, it may be a very long time -- thousands of years or longer -- before New Madrid becomes active again.

These research results have profound implications for the safety and design of critical facilities and structures such as nuclear power plants. Instead of a high risk of earthquakes in a few narrow zones in the central U.S. engineers and regulators may need to design for a lower risk over a much wider area. For non-critical structures in the New Madrid area, seismic design may not need to be done to specifications as strict as specifications for the west coast.

These USGS Seismic risk maps will need to be revised to incorporate the new data.

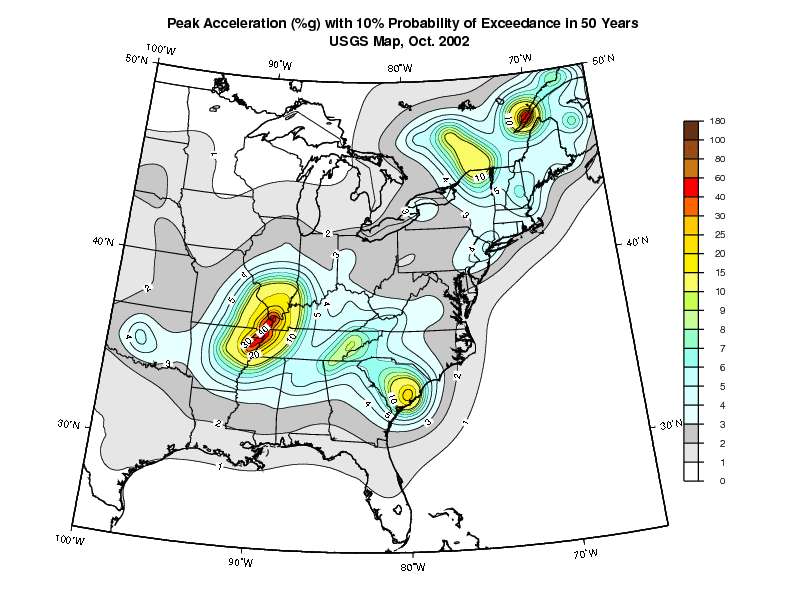
The U.S. Nuclear Regulatory Commission will need to incorporate the new information into assessments of seismic safety of nuclear power plants in the continental interior. The NRC can not assume that ancient rift and fault structures are totally inactive just because they have few or no historic earthquakes. These new studies show that many but not all of the ancient structures may be capable of damaging earthquakes.

Locations of nuclear power plants in the United States

A M7 earthquake is damaging over a wider area in the east and central U.S. because the lower crust and mantle dissipate energy more slowly than in the western U.S. If M7 earthquakes similar to the New Madrid earthquakes can occur over many ancient fault structures in the mid-continent region, much of the U.S. could suffer serious earthquake damage. However, the seismic risk in any given year is very low.


NASA: 130 years of global warming in 30 seconds

$
0
0

NASA has produced a stunning 27 second video that maps earth's temperature for the past 130 years. The rapid warming for the past 30 years concentrated in the Arctic is shocking.

The rapid warming in the last 30 years is eye opening, but the video does not show why it has happened. To understand why we need to examine the factors that are affecting the earth's temperature. These factors are called "climate forcings" by climatologists.

A 2011 paper by Dr Jim Hansen and colleagues examined all the important climate forcings in detail. This paper clearly shows that the rapid warming over the past 30 years is caused by rapidly increasing levels of greenhouse gases in the atmosphere.

Many climate skeptics have suggested that changes in solar activity are naturally causing the increasing temperatures, but examination of Hansen's paper and NASA's data on solar activity show that is a failed hypothesis. Solar activity was low from 1880 to 1920 and increased up to about 1980, then began to decline slowly just as the global temperature shot up over the past 30 years. The actual changes in solar activity are a fraction of 1% and exert a small influence on the global temperatures over the past 130 years.

The largest natural contributor to global temperature variations over the past 130 years is volcanism. Aerosols form large volcanic eruptions reflected a significant amount of incoming solar radiation from 1880 to 1920, causing a prolonged cool period. Low solar activity also contributed to causing the cool period. Volcanic activity was low from 1920 to the early 1960s and solar activity rose, causing natural warming. The effects of increasing levels of greenhouse gases produced by human activities were canceled out by rising levels of solar radiation reflecting air pollution.

Large volcanic eruptions in the 1960s caused a brief cooling period.

Despite continued volcanism which would have caused natural cooling, the climate warmed in the 70s through the mid 80s as Europeans and Americans reduced sulfate emissions form coal fired power plants and other sources. The reduction in aerosols from human activities canceled out the effects of high levels of aerosols from volcanic activity. Greenhouse gas emissions increased rapidly, starting a period of rapid global warming.

NOAA's Mauna Loa Hawaii Atmospheric CO2 Levels

Rate of Increase of Mauna Loa CO2 Levels

Climate records show a high degree of variability at the annual level as El Nino and La Nina cause annual highs and lows. The El Nino of 1998, which was one of the strongest in history, caused a high spike. Over decades, the peaks and valleys caused by El Ninos and La Ninas average out showing a long term trend of rapid global warming since 1980.

The recent uptick in CO2 emissions from Asia hasn't affected the long-term trend significantly yet because smog levels have risen with greenhouse gas emissions. When China and India cut levels of aerosol pollution the full effect of rising Asian greenhouse gas emissions will be evident.

Pythons Invade Everglades Devastating Mammals, Range Expanding Rapidly

$
0
0

Burmese Pythons as large as 20 feet lone have escaped from captivity, invaded the Everglades, and wiped out populations of mid-sized mammals. Python populations have expanded rapidly to nearly all of south Florida and now they are expanding north. These huge snakes thrive in urban and suburban environments where they may hide unobserved between feedings. The adaptable pythons are battling with alligators for the position of apex predator in south Florida.

Everglades alligator appears to be winning the battle with a Burmese python image credit:USGS

Medium sized mammals which were abundant in the twentieth century have vanished from the swampy southernmost part of the Everglades park where the python invasion began.

Road surveys totaling 56,971 km from 2003–2011 documented 9.3% decrease in the frequency of raccoon observations, decreases of 98.9% and 87.5% for opossum and bobcat observations, respectively, and failed to detect rabbits. Road surveys also
revealed that these species are more common in areas where pythons have been discovered only recently and are most abundant outside the python’s current introduced range.


Univ. of Florida photo of 15 foot, 162 pound Burmese python caught in the Everglades after it consumed a 6 foot long alligator.

North American mammals which have not faced predation by giant snakes for millions of years are apparently naive to the threat they pose. Invasive species like these snakes are able to expand populations rapidly because they have few natural enemies and prey are unwary. Even birds are threatened by the snakes which are known to climb trees. Endangered species which were rare before the snakes escaped into south Florida are now threatened with extinction.

Giant Burmese pythons have been seen swimming in open water in Florida Bay

Fishing guide Camp Walker, Catalyst Charters, of Islamorada, Fla., took this photo of a Burmese python swimming in Florida Bay from the end of Twisty Channel toward End Key on Nov. 16, 2011.

The giant snakes can thrive anywhere that alligators live according to Professor Frank Mazotti of the University of Florida.

“People might argue the ultimate boundaries, but there’s no part of this state that you can point at and say that pythons couldn’t live here,” he said. “We really need to be addressing the spread of these pythons. They’re capable of surviving anywhere in Florida, they’re capable of incredible movement — and in a relatively short period.”

Pythons are likely to colonize anywhere alligators live, he said — including North Florida, Georgia and Louisiana.

Eradication of the giant pythons, which may lay up to 100 eggs at a time, from south Florida is now impossible.

Burmese pythons have traits that increased their risk of establishment and that make their eradication difficult. Specifically, Burmese pythons:

    • grow rapidly to a large size (one over 16-feet long was captured in the Everglades in January 2012);
    • are habitat generalists (they can live in many kinds of habitats);
    • are dietary generalists (can eat a variety of mammals, birds and reptiles);
    • may be arboreal (tree-living) when young, which puts birds and arboreal mammals such as squirrels and bats at risk and provides another avenue for quick dispersal of the snakes;
    • are tolerant of urbanization (can live in urban/suburban areas);
    • are well-concealed “sit-and-wait” predators (difficult to detect and difficult to trap due to their infrequent movements between hiding places);
    • mature rapidly  and produce many offspring (females can store sperm and fertilize their eggs —which can number more than 100 — when conditions are favorable for bearing young);
    • achieve high population densities (resulting in a greater impact on native wildlife); and
    • serve as potential hosts for parasites and diseases of economic and human health significance.

As a result, Burmese pythons pose considerable challenges for the ecosystems of South Florida and many of the animals that live there, including threated and endangered species. Federal and state agencies or institutions are working hard to deal with the serious threats caused by this invasive species.  USGS research aims to help managers preserve and restore the Everglades’ ecosystems.

Government land managers are trying to stop the pythons from expanding to the Florida Keys and to central and northern Florida. However, because the pythons swim in open water and thrive in swamps and drainage ditches, stopping the pythons from spreading will be challenging.

Can the Everglades be Rid of These Pythons?

The odds of eradicating an introduced population of reptiles once it has spread across a large area are very low, pointing to the importance of prevention, early detection and rapid response.  And with the Burmese python now distributed across more than a thousand square miles of southern Florida, including all of Everglades National Park and areas to the north such as Big Cypress National Preserve, the chances of eliminating the snake completely from the region is low. However, controlling their numbers and preventing their spread are critical goals for South Florida land managers. For example, a number of Burmese pythons have been found in the Florida Keys, but there is no confirmation yet that a breeding population exists in the Keys.  Given a recent USGS study that showed the python’s apparent ability to disperse via salt water, island residents and resource managers need to stay vigilant so as to be able to detect and eliminate arriving pythons before they become established.

Burmese pythons should never have been allowed into the United States. On January 23 of this year the Fish and Wildlife Service placed a notice in the Federal Register prohibiting import and interstate transport of Burmese pythons, northern and southern African pythons, and the yellow anaconda. It's incredible it took so long to take this obvious step.

Climate Emergency: 2 Million Mexicans Have No Water & Drought Expanding Across Southern U.S.

$
0
0

Two million people have no water. Crops are wiped out in the northern half of the country. The worst drought in Mexico's history is likely to worsen until summer rains come devastating the northern half of Mexico, damaging Mexico's economy. Indigenous communities in rural northern Mexico have no water, no food and no crops. Communities have had no rain in 15 months. The Mexican government is mobilizing to bring food, water and jobs to the affected people.

MEXICO CITY – A drought that a government official called the most severe Mexico had ever faced has left two million people without access to water and, coupled with a cold snap, has devastated cropland in nearly half of the country.

The government in the past week has authorized $2.63 billion in aid, including potable water, food, and temporary jobs for the most affected areas, rural communities in 19 of Mexico’s 31 states. But officials warned that no serious relief was expected for at least another five months, when the rainy season typically begins in earnest.


Taharuma refugees, northern Mexco, fleeing their homes.
...thousands of people of the Tarahumara indigenous group, who live in the Sierra Madre range in northwest Mexico, have been coming down out of the mountains to seek food aid, because after two years of severe drought, coupled with unusual cold this winter, they are reaching their breaking point.  Faced with starvation, they have become climate refugees.

The Tarahumara are known in Mexico for their incredible endurance in long-distance running.  They are a proud people who have held themselves aloof from modernized Mexican culture, still keeping their ancient traditions of weaving, hunting and farming.  They still speak their ancestral language, and they have always been able to take care of themselves.

Until now.

In what is sure to be a trend in the coming years, it is the people who live furthest out on the margins of Empire who are affected first and most harshly by climate change.

Record extreme drought that set Texas on fire last summer also covered much of Mexico. While northern Texas got rain this fall, Mexico didn't. Northern Mexico is suffering through its second year of extreme drought. The North American drought monitor shows  severe, extreme and exceptional drought affecting most of Mexico on December 31, 2011.

The most recent U.S. drought map issued today shows severe drought across the southern third of the United States from California to Florida and North Carolina. The southern halves of California and Georgia have been exceptionally dry this winter to date.

The three month drought forecast released today is as harsh as I have ever seen.

The ongoing La Niña event favors drought persistence and development for the next 3 months across the southern tier of States, from southern California eastward into Florida and northward into the Carolinas. Much of this same area will also have enhanced odds for above-normal temperatures (from Arizona and Utah eastward to the Carolinas and mid-Atlantic). Although the Northwest finally received ample precipitation during the past two weeks (usually expected in the Northwest during a La Niña), moderate drought still lingered in eastern Washington, southern Oregon, most of California and Nevada, and central Utah from a very dry start to the winter season.

Unfortunately, short and medium-term forecasts maintain an upper-air ridge (high pressure) over the Far West, diverting the storms to the north and keeping decent moisture away from the region. And with another normally wet month (Feb) looking less so, the odds for significant drought improvement were lowered. Therefore, this outlook is more pessimistic toward drought recovery in northern California and Nevada, with less improvement and more persistence in these areas as compared to the Jan. 19 FMA USDO. To the south, despite early winter snowfall in Arizona and New Mexico, the odds for subnormal precipitation and above-normal temperatures across the Southwest are elevated in the monthly and seasonal outlooks. Therefore, persistence or development is forecasted across most of California, the Great Basin, Southwest, and southern Plains.

Some improvement is possible along the northern drought boundary in the central Great Plains and lower Delta with expected short-term moderate to heavy precipitation, favorable odds of above-normal February and FMA precipitation in the middle Mississippi, Ohio, and Tennessee Valleys, and persistent bouts of wet weather in this area since mid-October. Farther south and east, however, recent dryness and favorable odds of subnormal precipitation in the short and long-term maintains drought along the Gulf and southern Atlantic Coasts and expands it into the mid-Atlantic Coast. A dry (and cold) winter climatology, much below-normal precipitation (minimal snow) since the Fall, and equal odd chances (1- and 3-month outlooks) elevates the chances for persistence across the western Corn Belt and upper Midwest, with drought expansion possible in the central Dakotas.

The immediate cause of the exceptional drought is the second year of La Nina

La Niña, "the diva of drought," is peaking, increasing the odds that the Pacific Northwest will have more stormy weather this winter and spring, while the southwestern and southern United States will be dry.

Sea surface height data from NASA's Jason-1 and -2 satellites show that the milder repeat of last year's strong La Niña has recently intensified, as seen in this latest Jason-2 image of the Pacific Ocean.

The image is based on the average of 10 days of data centered on Jan. 8, 2012. It depicts places where the Pacific sea surface height is higher than normal (due to warm water) as yellow and red, while places where the sea surface is lower than normal (due to cool water) are shown in blues and purples. Green indicates near-normal conditions. The height of the sea surface over a given area is an indicator of ocean temperature and other factors that influence climate.

This is the second consecutive year that the Jason altimetric satellites have measured lower-than-normal sea surface heights in the equatorial Pacific and unusually high sea surface heights in the western Pacific.

"Conditions are ripe for a stormy, wet winter in the Pacific Northwest and a dry, relatively rainless winter in Southern California, the Southwest and the southern tier of the United States," says climatologist Bill Patzert of JPL. "After more than a decade of mostly dry years on the Colorado River watershed and in the American Southwest, and only two normal rain years in the past six years in Southern California, low water supplies are lurking. This La Niña could deepen the drought in the already parched Southwest and could also worsen conditions that have fueled recent deadly wildfires."

However, because there is another factor which may be making La Nina caused droughts more severe. As the climate warms the dry subtropical belts under the subtropical high pressure areas may be expanding. The expansion of the "Hadley cell" moves the storm track northward on the Pacific coast. This reduces rainfall and snowfall in Mexico, California and the southwestern United States.

Earth's solar energy is most concentrated in the region of the equator.This heating causes warm air to rise, which creates a general area of low pressure at the equator. As the rising air cools and starts to fall back toward Earth it spreads into both the northern and southern hemispheres (see figure) and returns to the surface of Earth at approximately 30 degrees north and south of the equator. That cooled air is then drawn back towards the low-pressure area at the equator and repeats the circulation. This circulation creates what are known as the Hadley Cells.

The combination of La Nina plus climate change driven expansion of the subtropical high may be what caused this drought to be the worst in the history of Mexico and Texas.

NASA's Jim Hansen and colleagues have recently released a pre-publication report that concludes the probability was virtually nil that the drought and heat wave in Texas, Oklahoma and Mexico was the result of natural variability.

Most scientists are careful not to link specific weather events to climate change trends, but NASA's James Hansen and two colleagues from the NASA Goddard Institute for Space Studies and Columbia University have taken that plunge. They've gathered data they say shows that the 2011 Texas and Oklahoma heat wave—as well as a deadly Moscow heat in 2010—were "a consequence of global warming because their likelihood was negligible prior to the recent rapid global warming."

Their conclusions are based on more than 50 years of temperature data, Hansen told InsideClimate News. By comparing the recent shift toward extreme high summer temperatures with that data, he said his group was able to demonstrate that the record-breaking 2011 Texas heat wave wouldn't have occurred without global warming.
....break...

"Our paper deals with the frequency of hot seasons, mainly hot summers, because that is the most important season," Hansen said. "The times and places with hot summers tend to be where the weather is dominated ... by high pressure, so there is high correspondence between the [extremely hot outliers or extreme] heat waves and drought conditions." They also point out that summer, "when most biological productivity occurs, is the most important season for humanity and thus the season when climate change may have its biggest impact."

Dr. Hansen and colleagues use a statistical approach he calls "climate dice" to assess the probability that extreme weather events such as the Texas-Mexico heat wave are the result of human-caused climate change. He concludes that global warming has loaded the dice.

"Climate dice", describing the chance of unusually warm or cool seasons relative to climatology, have become progressively "loaded" in the past 30 years, coincident with rapid global warming. The distribution of seasonal mean temperature anomalies has shifted toward higher temperatures and the range of anomalies has increased. An important change is the emergence of a category of summertime extremely hot outliers, more than three standard deviations (σ) warmer than climatology. This hot extreme, which covered much less than 1% of Earth's surface in the period of climatology, now typically covers about 10% of the land area. We conclude that extreme heat waves, such as that in Texas and Oklahoma in 2011 and Moscow in 2010, were "caused" by global warming, because their likelihood was negligible prior to the recent rapid global warming. We discuss practical implications of this substantial, growing climate change.

Sea Ice Collapse Links to Deadly Weather and Irreversible Climate Change

$
0
0

Scientists studying the Arctic are stunned at the rapid disappearance of sea ice and prolonged record high temperatures on the Atlantic side of the Arctic ocean which have occurred simultaneously with a brutal cold wave in Europe. Temperatures at the Svalbard airport have averaged 24.8°F (13.8°C) above normal for the past 30 days.

Svalbard Airport observation station
The station was established in August 1975. Last 30 days: Average temperature was -1.9 °C (28.6°F), 13.8 °C (24.8°F) above the normal. Highest temperature was 7.0 °C (44.6°F) on 08 February, and the lowest was -15.0 °C (5°F) on 25 January.

Storms have moved from the north Atlantic into the Arctic transporting warm air with them. Moreover, the storms generate strong southerly winds along the coast of Norway that increases the rate of flow of warm, salty water into the Arctic.

February 9 composite satellite photo from University of Wisconsin's SSEC shows an intense storm carrying heat and moisture from the Atlantic deep into the Arctic.

A leading climate scientist links the deadly European cold wave to the loss of sea ice.

"The current weather pattern fits earlier predictions of computer models for how the atmosphere responds to the loss of sea ice due to global warming," said Professor Stefan Rahmstorf of the Potsdam Institute for Climate Impact Research. "The ice-free areas of the ocean act like a heater as the water is warmer than the Arctic air above it. This favours the formation of a high-pressure system near the Barents Sea, which steers cold air into Europe."

What goes up must come down. Warm air which rose up in storms over open water in the Arctic formed a dome over northwestern Siberia. The air subsided over Siberia enhancing the huge Siberian high. Clear cold conditions under that high pressure area radiated heat efficiently out of the atmosphere producing very low surface temperatures during the dark Siberian mid-winter. Easterly winds developed at low levels south of the high pressure dome driving cold air from western Siberia into Europe.

A vast expanse of open ocean in an area that was recently covered by thick sea ice is changing the weather and the climate. Sea Ice Average for January 1976 - 2006

Sea Ice February 9, 2012

Professor Rahmstorf said the Alfred Wegener study confirms earlier predictions from computer models by Vladimir Petoukhov of the Potsdam Institute, who forecast colder winters in western Europe as a result of melting sea ice.

Dr Petoukhov and his colleague Vladimir Semenov were among the first scientists to suggest a link between the loss of sea ice and colder winters in Europe. Their 2009 study simulated the effects of disappearing sea ice and found that for some years to come the loss will increase the chances of colder winters.

"Whoever thinks that the shrinking of some far-away sea ice won't bother him could be wrong. There are complex interconnections in the climate system, and in the Barents-Kara Sea we might have discovered a powerful feedback mechanism," Dr Petoukhov said.

Over the past 30 days sea ice area has declined to the lowest level measured in winter in the Kara Sea

That initial study has been followed by additional studies that have found that the loss of Arctic sea ice changes the northern hemisphere's atmospheric circulation. A recent study using numerical models predicted that increasing storminess over the area of newly opened waters of the Arctic ocean would start a feed-back loop that would further reduce sea ice cover. That is exactly what we are observing now from summer 2011 into January and February of 2012. The lack of reflective sea ice in summer begins a positive feedback loop. Less heat is reflected back to space over open water than over ice. That heat is stored in the upper ocean. In the fall and winter that heat tends to bring more storminess between Norway and Greenland which speeds up the currents bringing warm water along the coast of Norway into the Arctic ocean and along the coast of Greenland taking sea ice out of the Arctic ocean.

The reduced sea ice concentration at the end of the Arctic summer has the potential to change the large scale circulation in the following winter that could feed back on the sea ice concentration. This sea ice-atmosphere relationship suggests a potential for use in operational Northern Hemisphere seasonal forecasts. Sea ice cover loss has the potential to preferentially shift the probability density function of the AO/NAO to the negative phase, in agreement with the investigations by Overland and Wang (2010).
Measurements of the east Greenland current by synthetic aperature Doppler radar found that the rate of transport of sea ice from the Arctic ocean through the Fram strait to the Atlantic ocean has increased by 25% since the 1960's. When the Arctic was covered with thick multi-year sea ice the changes were hard to distinguish from normal variability. Over the past 2 decades this increasing speed has significantly contributed to the feedback loop which is causing the rapid decline of Arctic sea ice.

We found a robust trend for 1957–2010 with a magnitude of 5% per decade, and similar trends onwards from 1970, 1980 and 1990. This indicates a gradually increasing ice export over the last 50 years, and is a direct change in boundary conditions to the Arctic sea ice. The positive trend is produced by a trend in the local pressure gradient, related to intensification of cyclones over the Nordic Seas.
This positive feedback loop is causing the collapse of sea ice cover in the Arctic, which will irreversibly change the atmospheric circulation patterns and the world's weather.

A study of the "Little Ice Age" just published by the American Geophysical Union found that the changed to a cold climate was triggered by 4 large volcanic eruptions over a 50 year period. The eruptions caused the climate to cross a threshold or "tipping point". The sea ice that built up after the volcanic eruptions reflected solar radiation back to space, keeping the climate cold. Large volcanic eruptions triggered the Little Ice Age.  Once it started, sea ice feedbacks maintained it.

Here we present precisely dated records of ice-cap growth from Arctic Canada and Iceland showing that LIA summer cold and ice growth began abruptly between 1275 and 1300 AD, followed by a substantial intensification 1430–1455 AD.

Intervals of sudden ice growth coincide with two of the most volcanically perturbed half centuries of the past millennium. A transient climate model simulation shows that
explosive volcanism produces abrupt summer cooling at these times, and that cold summers can be maintained by sea-ice/ocean feedbacks long after volcanic aerosols are removed. Our results suggest that the onset of the LIA can be linked to an
unusual 50-year-long episode with four large sulfur-rich explosive eruptions, each with global sulfate loading >60 Tg.

The persistence of cold summers is best explained by consequent sea-ice/ocean feedbacks during a hemispheric summer insolation minimum; large changes in solar irradiance are not required.

Human emissions of greenhouse gases to the atmosphere have warmed the climate and melted sea ice for the past 50 years, just like the 50 years of intense volcanism in reverse. Just as the 50 years of volcanic activity caused hundreds of years of cold we have triggered feedback loops that will maintain and increase hundreds of years of warmth. And we are now emitting more greenhouse gases than ever.

There is no reversing it. We will have to deal with the consequences. The first rule of holes is to stop digging. More feedback loops with even more severe consequences kick in as greenhouse gas levels and temperatures rise higher.

If humanity has ever faced a more serious threat, I do not know of it.

AP Verifies Denialgate Docs, Oily Scam to Teach Lies about Climate Science in Schools: Updated

$
0
0

The Associated Press has verified the authenticity of leaked documents that show a leading conservative organization, the Heartland Institute, schemed to propagandize school children into becoming climate skeptics on behalf of major corporate sponsors. One anonymous sponsor contributed 14 million dollars. At first Heartland attempted to deny the authenticity of the documents, but now Joe Bast, the director of Heartland has admitted one of his employees e-mailed them to a stranger.

Now, we have a case where Bast admits that some dope on his staff emailed Heartland's whole board package to a stranger. Yet rather than praising the opportunity that this provides for independent observers to judge the performance of a taxpayer-subsidized body (Heartland is a registered charity), as Bast did when someone stole the so-called ClimateGate emails from leading scientists such as Mike Mann, the Heartland boss has attacked the veracity of the Climate Strategy and used that to attempt to dismiss the legitimacy of the other material (Heartland Institute Responds to Stolen and Fake Documents).
This is rich. Bast & Co. smeared climate scientists for months after stealing their private e-mails. One of his employees voluntarily sent these e-mails to a blogger at DeSmogBlog and he is crying like a toddler that dropped his sippy cup. Pass the popcorn.
How did this happen? The stolen documents were obtained by an unknown person who fraudulently assumed the identity of a Heartland board member and persuaded a staff member here to “re-send” board materials to a new email address. Identity theft and computer fraud are criminal offenses subject to imprisonment. We intend to find this person and see him or her put in prison for these crimes.

Apologies: The Heartland Institute apologizes to the donors whose identities were revealed by this theft. We promise anonymity to many of our donors, and we realize that the major reason these documents were stolen and faked was to make it more difficult for donors to support our work. We also apologize to Heartland staff, directors, and our allies in the fight to bring sound science to the global warming debate, who have had their privacy violated and their integrity impugned.

Hey, Joe, go right ahead and sue. Expose your fraud to the world. See how your anonymous sponsors respond to the publicity when their names are attached to schemes to deceive children and average Americans on climate change.
.....

Update: The LA Times notes Heartland's Karma.

That’s not quite how Heartland saw things in November 2009, when someone hacked the correspondence of some of the world’s leading climate scientists working with the University of East Anglia in Britain and released thousands of emails, with the intention of suggesting that researchers had massaged data to show that the planet was warming.

“The release of these documents creates an opportunity for reporters, academics, politicians, and others who relied on the IPCC to form their opinions about global warming to stop and reconsider their position,” wrote Joseph Bast, Heartland’s president. “The experts they trusted and quoted in the past have been caught red-handed plotting to conceal data, hide temperature trends that contradict their predictions, and keep critics from appearing in peer-reviewed journals. This is new and real evidence that they should examine and then comment on publicly.”

Every independent panel that has looked into the East Anglia emails has cleared the scientists of wrongdoing. British law enforcement, with the help of the U.S. Justice Department, continues to investigate the hacking case.

...... end update.....

Heartland is trying to claim that one of the documents is a fake, and create doubt about the others,  but AP isn't buying it. AP reconfirmed the attempt to propagandize school children with lies. AP also confirmed that Anthony Watts is a hack paid to create uncertainty and doubt on climate science, just like Heartland's hacks previously tried to created uncertainty and doubt about the deadly effects of cigarette smoke. Heartland continues to take tobacco company money and promote their interests. Some of the scientists, such as Fred Singer, that promoted uncertainty on smoking have moved on the promoting uncertainty on climate change.

As detailed in the papers, Heartland's plans for this year included paying an Energy Department consultant $100,000 to design a curriculum to teach school children that mainstream global warming science is in dispute, even though it's a fact accepted by the federal government and nearly every scientific professional organization. It also pays prominent global warming skeptics more than $300,000 a year and plans to raise $88,000 to help a former television weatherman set up a new temperature records website.
......

David Wojick, a Virginia-based federal database contractor, said in an email that the document was accurate about his project to put curriculum materials in schools that promote climate skepticism.

"My goal is to help them teach one of the greatest scientific debates in history," Wojick said. "This means teaching both sides of the science, more science, not less."

There is no controversy. There is no debate. The basic science of the greenhouse effect was worked out at the end of the 19th century by Svante Arrhenius. The basic science has been settled for over 100 years. Arrhenius' work has been reconfirmed by study after study. A recent report in the Proceedings of the National Academy of Sciences found that 97% of the 1300 most published climate scientists agreed that today's climate change is man-made.

A number of Heartland's donors are none too happy about being tied to Heartland's climate change deception.(Original source, NY Times)

   “We absolutely do not endorse or support their views on the environment or climate change,” said Sarah Alspach, a spokeswoman for GlaxoSmithKline, a multinational drug company shown in the documents as contributing $50,000 in the past two years to support a medical newsletter.

    A spokesman for Microsoft, another listed donor, said that the company believes that “climate change is a serious issue that demands immediate worldwide action.” The company is shown in the documents as having contributed $59,908 last year to a Heartland technology newsletter. But the Microsoft spokesman, Mark Murray, said the gift was not a cash contribution but rather the value of free software, which Microsoft gives to thousands of nonprofit groups.

dKos LINKS

ASiegal's report on Denialgate with many links to sources.

Loblolly's post discussing Heartland's attempted K1-12 curriculum manipulation.

MeteorBlades front page post on Denialgate.

11:14 AM PT: Update from the comments

Heartland has violated its non-profit status by lobbying the federal government and posing as an educational institution while it engages in political activities. That is tax fraud. Here's a model form to complain of fraud to the IRS. (PDF) http://profmandia.files.wordpress.com/...


eSci: Global Cooling - Record Cold Jan-Mar 2012

$
0
0

Global lower stratospheric temperatures in January to March 2012 were the coldest ever measured (by satellites) according to Remote Sensing Systems (RSS). A cooling lower stratosphere is strong evidence of a strengthening greenhouse effect caused by increasing levels of greenhouse gases in the lower atmosphere (the troposphere). Heat from the lower atmosphere is radiated upwards at lower temperatures as increasing levels of greenhouse gases trap more heat in the troposphere. The lower stratosphere, which lies just above the troposphere receives less heat from below. Lower stratospheric cooling was  predicted by climate scientists before it was observed. The combination of a warming troposphere and cooling lower stratosphere cannot be explained by external factors such as a warming sun or more cosmic rays. A warming sun would warm both the troposphere and the lower stratosphere.

Global Ecosystem "is approaching a planetary-scale critical transition" Warn Scientists

$
0
0

When disturbance of local ecosystems exceeds 50% they may suddenly collapse into simpler, less biodiverse systems with the loss of many species. An interdisciplinary team of scientists published a report in Nature today warning that they have found evidence that the global ecosystem can transition the same way with potentially catastrophic consequences for human populations. The scientists aren't able to predict when the transition will happen because it happens suddenly at some point from 50% to 90%. Presently 43% of earth's land surface has been changed to urban or agricultural use and much of the rest is fragmented by roads.

Localized ecological systems are known to shift abruptly and irreversibly from one state to another when they are forced across critical thresholds... the global ecosystem as a whole can react in the same way and is approaching a planetary-scale critical transition as a result of human influence.
“It really will be a new world, biologically, at that point,” warns Anthony Barnosky, professor of integrative biology at the University of California, Berkeley, and lead author of a review paper appearing in the June 7 issue of the journal Nature. “The data suggests that there will be a reduction in biodiversity and severe impacts on much of what we depend on to sustain our quality of life, including, for example, fisheries, agriculture, forest products and clean water. This could happen within just a few generations.”
When the tipping point is crossed it could be similar to a collapse described by Jared Diamond in his book, but on a global scale.
The authors note that studies of small-scale ecosystems show that once 50-90 percent of an area has been altered, the entire ecosystem tips irreversibly into a state far different from the original, in terms of the mix of plant and animal species and their interactions. This situation typically is accompanied by species extinctions and a loss of biodiversity.

Currently, to support a population of 7 billion people, about 43 percent of Earth’s land surface has been converted to agricultural or urban use, with roads cutting through much of the remainder. The population is expected to rise to 9 billion by 2045; at that rate, current trends suggest that half Earth’s land surface will be disturbed by 2025. To Barnosky, this is disturbingly close to a global tipping point.

“Can it really happen? Looking into the past tells us unequivocally that, yes, it can really happen. It has happened. The last glacial/interglacial transition 11,700 years ago was an example of that,” he said, noting that animal diversity still has not recovered from extinctions during that time. “I think that if we want to avoid the most unpleasant surprises, we want to stay away from that 50 percent mark.”


Bee Collapse Triggered by Parasitic Mite Transformed Virus

$
0
0

An invasive parasitic mite has transformed an apparently harmless virus into a global destroyer of honey bee colonies. A new report in Science chronicles the catastrophic effects of the accidental introduction of the parasitic Varroa Destructor mite into the Hawaiian Islands. The deformed wing virus (DWV), which had been carried by 10% of the Hawaiian honey bees affected 100% of the bees after several years of mite infestation and the viral titer became a million times stronger. Several viral variants were selectively replicated by the mite transforming them into colony destroyers over a period of a few years. World trade in honey bees has expanded the range of the Varroa mite from Asia to most of the continents. The authors think that the process they observed in Hawaii had already happened in Europe and the Americas causing bee colonies to collapse.
 

Many factors are likely to influence the DWV variant population in different colonies, but the arrival of DWV variants that can replicate in the mite means that these strains would rapidly increase in abundance. There have been no major introductions of honey bees into Hawaii, because strict importation regulations have been enacted since the widespread occurrence of Varroa mites. It seems likely that the now mite-associated European DWV variants were already present in honey bee populations before the arrival of the mites. Studies in the United Kingdom and New Zealand (24) have found that DWV infections and colony collapse did not coincide with the arrival and establishment of Varroa, but there was with a 1- to 3-year time lag, which we also observed on Hawaii. This lag appears to be the time required for the selection of virus variants adapted to mite transmission.
This study doesn't rule out other possible causes of bee colony collapse such as nicitinoid pesticides. Bees face many more threats than they did fifty years ago because bees are transported globally, spreading diseases and parasites across continents. The introduction of mites into Hawaii offered the unique opportunity to study the disease processes related to mites while other variables remained constant.
But the mite's arrival in Hawaii in 2007 gave scientists a unique opportunity to track its deadly spread. "We were able to watch the emergence of the disease for the first time ever," said Stephen Martin, at the University of Sheffield, who led the new research published in the journal Science. Within a year of varroa arrival, 274 of 419 colonies on Oahu island (65%) were wiped out, with the mites going on to wreak destruction across Big Island the following year.

A particular virus, called deformed wing virus (DWV), was present in low and apparently harmless levels in colonies before the mites arrived, the scientists found. Even when the mites first invaded hives, the virus levels remained low. "But the following year the virus levels had gone through the roof." said Martin. "It was a millionfold increase – it was staggering."

Shocking Interglacial Shift to Hot Arctic Tied to Rapid Antarctic Ice Melt

$
0
0

Stunning spikes of Arctic heat in interglacial periods, far warmer than predicted by existing climate models, may be caused by rapid melting of Antarctic ice. The ocean overturning circulation around Antarctica may have suddenly shut down, triggering rapid warming of the north Pacific and north Atlantic oceans and the northern hemisphere. A continuous record Arctic climate of the past 2.8 million years is preserved in sediments of a deep lake formed by impact of a massive meteorite 3.6 million years ago in north east Siberia. Climate scientists studying the sediment cores were shocked to find multiple episodes of temperatures 4C to 5C (7 to 9 degrees Fahrenheit) greater than normal interglacial periods. Standard climate models could not predict these super warm periods. However, the researchers found that shutting down the Antarctic overturning circulation, the opposite of popularized episodes of "shutting down the Gulf Stream", could cause the sudden onset of extreme Arctic heating.

Fresh water released by the rapid melting of Antarctic ice could cause this rapid shift in ocean circulation patterns. This shut down of the southern hemisphere's equivalent of the north Atlantic overturning circulation could happen again if global warming rapidly destabilizes Antarctic ice sheets. The research was published ahead of print in highly-respected Science Magazine.

Linkages between extraordinary warmth at Lake El’gygytgyn and Antarctic ice volume imply strong intra-hemispheric climate coupling that could be related to reductions in Antarctic Bottom Water (AABW) formation (47) during times of ice sheet/shelf retreat and elevated fresh water input into the Southern Ocean. This is supported by distinct minima in AABW inflows into the southwest Pacific during MIS 11 and MIS 31 (48). As a consequence, changes in thermohaline circulation (THC) during MIS 11 and MIS 31 might have reduced upwelling in the northern North Pacific (49), as indicated by distinctly lower BSi concentrations compared to  interglacials at ODP Site 882 (50, 51). A stratified water column during the super interglacials would have resulted in higher sea surface temperatures in the northern North Pacific, with the potential to raise air temperatures and precipitation rates over adjacent land masses via effects on the dominant pressure patterns (Siberian High and Aleutian Low) that dominate the modern climatology at thelake (52).
In summary, the scientists found when cold water stopped sinking around Antarctica, it stopped welling up in the north Pacific, triggering rapid warming of surface waters in the north Pacific ocean. The warm north Pacific caused warming of the Arctic and the northern hemisphere.

 NSF press release about article in Science magazine.

To quantify the climate differences, the scientists studied four warm phases in detail: the two youngest, called "normal" interglacials, from 12,000 years and 125,000 years ago; and two older phases, called "super" interglacials, from 400,000 and 1.1 million years ago.

According to climate reconstructions based on pollen found in sediment cores, summer temperatures and annual precipitation during the super interglacials were about 4 to 5 degrees C warmer, and about 12 inches wetter, than during normal interglacials.

The super interglacial climates suggest that it's nearly impossible for Greenland's ice sheet to have existed in its present form at those times.

Simulations using a state-of-the-art climate model show that the high temperature and precipitation during the super interglacials can't be explained by Earth's orbital parameters or variations in atmospheric greenhouse gases alone, which geologists usually see as driving the glacial/interglacial pattern during ice ages.

Modeling and paleoclimate records have shown when the ice cap in Greenland melts rapidly, it may cause sudden onset of cold episodes in North America and Europe (and rapid  warming in Antarctica. Thus if warming rates caused by increasing GHG levels are rapid, wild oscillations of hot and cold might be triggered in Europe and north America by the oscillations in the overturning circulations in the southern ocean and the north Atlantic.

Drought Disaster Declared in 1016 Counties in 26 States by USDA

$
0
0

Withering severe to extreme drought, covering most of the southern two-thirds of the United States, has led the U.S. Department of Agriculture to make its largest disaster declaration ever. Extensive crop damage, triggered by months of drought and the hottest June in American history, is decimating the largest corn crop ever planted in the U.S. Every state in the southern half of the country, except for Virginia and West Virginia is affected by the drought declaration. The combination of the end of a two year La Nina event and global warming set the stage for dome of hot air to build up over the midcontinent this June, smashing all-time temperature records from Colorado to the Carolinas. The hot dry air literally sucked the moisture out of crops.

Food and commodity prices are rising in response to the drought.

A drought disaster hasn't been declared in Iowa, the largest corn producer, but this week's drought monitor shows that Iowa, too, is affected by the drought. The heat and drought has expanded into the central and northern midwest.

In the 18 primary corn-growing states, 30 percent of the crop is now in poor or very poor condition, up from 22 percent the previous week. In addition, fully half of the nation’s pastures and ranges are in poor or very poor condition, up from 28 percent in mid-June. The hot, dry conditions have also allowed for a dramatic increase in wildfire activity since mid-June. During the past 3 weeks, the year-to-date acreage burned by wildfires increased from 1.1 million to 3.1 million as of this writing.
This is what climate scientists told you was coming.

Updated: Greenland Heat, Melting & Darkening Stuns Scientists as Ice Goes Into Death Spiral

$
0
0

Greenland Ice Darkening


Dark surface of Greenland icecap in summer, photo by Jason Box, PhD.

The ends of the ice ages were triggered when earth's wobble placed the Arctic in position to receive maximum summer time solar heating. The relatively small effects of the orbital variations were amplified by the melting of snow and ice which reflect sunlight back to space. Because rock and water take up heat from sunlight, ice loss adds heat to the environment, leading to more ice loss.  Ultimately, this feedback loop led to the melting of large continental glaciers ten thousand feet thick. Today the same process is taking place at a rapid rate as the area of Arctic sea ice rapidly declines, the ice of Greenland darkens and the snows of Siberia melt weeks earlier in spring.


Greenland June ice darkened rapidly in 10 years. image by Jason Box, PhD.

Just as sandy, windblown deserts develop stony pavements by the wind removing fine particles, ablation of Greenland's ice produces a dark pavement of particles. Warming of the atmosphere has increased the rate of ablation of Greenland's ice, exposing more dark light adsorbing particles, increasing the heating of the icecap. Moreover, melting and refreezing causes ice grain sizes to grow. Larger ice grains reflect less light. Granular ice is less reflective than fresh snow. Low snowfall amounts last winter may also play a part in causing this June's reflectivity to drop.

Ice sheet reflectivity this year has been the lowest since accurate records began in March, 2000. In this condition, the ice sheet will continue to absorb more solar energy in a self-reinforcing feedback loop that amplifies the effect of warming. It’s not a runaway loop, just an amplifier. A record setting melt season is likely if this pattern keeps up this year.

Perhaps most remarkable about the 2012 pattern is how much darker the snow and ice is becoming, not only at the lowest elevations around the ice sheet periphery where melting is always most intense, but in the higher elevation net snow accumulation area. June monthly average reflectivity is below the 2000-2011 average across the southern-central area where surface elevations are above 2,000 m (6,561 feet). A purple area about 1/4 the distance north of the ice sheet southern tip at an elevation of 2,400 m (7,874 ft) has reflectivity  7% below the already declining 2000-2011 June (12 year) average.

Consistent with the low albedo anomaly at high elevations is the shift of the summer radiation balance from negative (cooling) to positive (heating) (Box et al. 2012). In the 12 years between 2000 and 2011 the high elevation ice sheet net radiation (sum of upward and downward solar and infrared radiation) approached positive values. What I expect we will see if these low albedo conditions persist is 100% surface melting over the ice sheet. This would be a first in observations. It may not happen this year, but the trajectory the ice sheet is on, along with amplified Arctic warming, will have the ice sheet responding by melting more and more.

The jet stream has gone north of Greenland this summer

Greenland's 10,000 foot altitude is an obstacle to the atmospheric circulation. Usually the jet stream solves this problem by staying to the south of Greenland, keeping it cold at the summit all year round. This summer temperatures have risen above freezing at the summit station 10,000 feet above sea level. These temperatures are the highest ever measured at the summit. The atmospheric anomalies over Greenland are greater than the anomalies that caused record heat over the United States. The shocking dome of warm air over Greenland produced one bizarre cold anomaly as it forced the jet stream south on its east coast towards England. English climate change deniers are having a field day in the cold and wet as the rest of the northern hemisphere bakes and melts. The jet stream has contracted to a shocking degree from its normal extent over the past 90 days. This bizarre contracted circulation pattern is leading to record ice melt across the Arctic and unprecedented melting in Greenland.

Greenland's ice sheet is now melting from top to bottom, shocking scientists

Extent of surface melt over Greenland’s ice sheet on July 8 (left) and July 12 (right). Measurements from three satellites showed that on July 8, about 40 percent of the ice sheet had undergone thawing at or near the surface. In just a few days, the melting had dramatically accelerated and an estimated 97 percent of the ice sheet surface had thawed by July 12. In the image, the areas classified as “probable melt” (light pink) correspond to those sites where at least one satellite detected surface melting. The areas classified as “melt” (dark pink) correspond to sites where two or three satellites detected surface melting. The satellites are measuring different physical properties at different scales and are passing over Greenland at different times. As a whole, they provide a picture of an extreme melt event about which scientists are very confident. Credit: Nicolo E. DiGirolamo, SSAI/NASA GSFC, and Jesse Allen, NASA Earth

The stunned NASA scientist who first observed the unprecedented melting thought her instruments were in error.

For several days this month, Greenland's surface ice cover melted over a larger area than at any time in more than 30 years of satellite observations. Nearly the entire ice cover of Greenland, from its thin, low-lying coastal edges to its two-mile-thick center, experienced some degree of melting at its surface, according to measurements from three independent satellites analyzed by NASA and university scientists.

On average in the summer, about half of the surface of Greenland's ice sheet naturally melts. At high elevations, most of that melt water quickly refreezes in place. Near the coast, some of the melt water is retained by the ice sheet and the rest is lost to the ocean. But this year the extent of ice melting at or near the surface jumped dramatically. According to satellite data, an estimated 97 percent of the ice sheet surface thawed at some point in mid-July. ...snip NASA press release...

Son Nghiem of NASA's Jet Propulsion Laboratory in Pasadena, Calif., was analyzing radar data from the Indian Space Research Organisation's (ISRO) Oceansat-2 satellite last week when he noticed that most of Greenland appeared to have undergone surface melting on July 12. Nghiem said, "This was so extraordinary that at first I questioned the result: was this real or was it due to a data error?"

Nghiem consulted with Dorothy Hall at NASA's Goddard Space Flight Center in Greenbelt, Md. Hall studies the surface temperature of Greenland using the Moderate-resolution Imaging Spectroradiometer (MODIS) on NASA's Terra and Aqua satellites. She confirmed that MODIS showed unusually high temperatures and that melt was extensive over the ice sheet surface.

Thomas Mote, a climatologist at the University of Georgia, Athens, Ga; and Marco Tedesco of City University of New York also confirmed the melt seen by Oceansat-2 and MODIS with passive-microwave satellite data from the Special Sensor Microwave Imager/Sounder on a U.S. Air Force meteorological satellite.

The melting spread quickly. Melt maps derived from the three satellites showed that on July 8, about 40 percent of the ice sheet's surface had melted. By July 12, 97 percent had melted.

This extreme melt event coincided with an unusually strong ridge of warm air, or a heat dome, over Greenland. The ridge was one of a series that has dominated Greenland's weather since the end of May. "Each successive ridge has been stronger than the previous one," said Mote. This latest heat dome started to move over Greenland on July 8, and then parked itself over the ice sheet about three days later. By July 16, it had begun to dissipate.

Even the area around Summit Station in central Greenland, which at 2 miles above sea level is near the highest point of the ice sheet, showed signs of melting. Such pronounced melting at Summit and across the ice sheet has not occurred since 1889, according to ice cores analyzed by Kaitlin Keegan at Dartmouth College in Hanover, N.H. A National Oceanic and Atmospheric Administration weather station at Summit confirmed air temperatures hovered above or within a degree of freezing for several hours July 11-12. (ed note: I examined the temperature record on line. High temperatures were a degree above freezing on consecutive days at the summit.)

The record melting has caused unprecedented flooding on coastal rivers.

The heat may also be speeding up the break up of the Peterman glacier. Much above normal water temperatures, as much as 5 degrees Celsius above normal, are undermining Greenland's outlet glaciers from below.

Peterman Glacier in northwest Greenland just spawned an ice island the size of 2 Manhattan Islands. In 2010 it also spawned a huge island of about the same size.

NASA Made up 150 year melt cycles; NY Times Slammed NASA for "Unprecedented" Melt Every 150 Years

$
0
0

NASA's press release on the stunning melt event in Greenland where 97% of the surface melted (Note: not mass or volume. A relatively thin layer melted.) downplayed the severity of the event by implying that it was a cyclical weather event that occurs every 150 years. I omitted the paragraph mentioning the "150 year events" from my initial post because I thought it was inconsistent with the climate of the past 2000 years and was misleading. Now, it appears to me from the PBS interview below that NASA management may have coached the young scientist to mention the 150 year "cycles" for political purposes to downplay the possible connections to global warming.

"Ice cores from Summit show that melting events of this type occur about once every 150 years on average. With the last one happening in 1889, this event is right on time," says Lora Koenig, a Goddard glaciologist and a member of the research team analyzing the satellite data. "But if we continue to observe melting events like this in upcoming years, it will be worrisome."
Tom Wagner, NASA scientist and manager, gave an excellent interview on PBS except for omitting discussion of the recent years' trend of warming, melting and darkening. He made this melt event sound like it was caused by a semi-cyclical weather event which occurs, on average, every 150 years.  Moreover, he admits to having coached the young scientist to write about this "150 year" melt event. In fact, melt events have occurred at a much lower frequency than every 150 years over the past 4000 years. Melt events were much more frequent than every 150 years from 4000 to 8000 years before present when the summer sun was a lot hotter in the Arctic than it is now. Averaging the warm period that happened 4000-8000 years ago with the cool period of the past 4000 years "created" the 150 year "cycles".

Koenig and Wagner refer to  a classic paper on Greenland ice cores to support their claim of an approximate 150 year period, but the first paragraph of the paper's conclusion makes clear that the climate was warmer 4000 to 8000 years ago, with far more frequent melt events.

CONCLUSIONS

The frequency of melting at the GISP2 site in central Greenland has decreased significantly from a maximum about 7000-7500 BP. This could have been caused by a
change in summer temperature variability over time, but probably represents a cooling of summer temperatures.

Calibration of this signal suggests that the cooling has been within a few tenths of a degree of 1.3° C. We interpret available ice-flow-modeling results as indicating little change in ice-surface elevation through the atmospheric lapse rate over this time, so the signal is probably climatic rather than glaciological .

Melt Events over the past 10,000 years at the Greenland Summit
Fig. 1. Melt against age (upper panel) and July insolation against age (lower panel) for the GlSP2 site. Years containing melt features are shown by thin dotted lines. The heavier textured line is the 100 a running mean of melt frequency (number of melt features per 100 years), and the heavy black line is the 1000 annum running mean. The lower panel shows deviation of July insolation )from modern values in cal cm2/d, )from Berger (1978, 1979); positive values indicate more insolation than today. Note: right hand side is 10,000 before 1950, left hand side is 1950 (figure was hard to copy).

New York Times Reporter and Blogger Andrew Revkin then slammed NASA for using the word "unprecedented" in the title of their press release instead of challenging NASA on the confabulated 150 year semi-cycles. Revkin and the Times, didn't stop there. He then took a shot at Dr. Joe Romm of the Center for American Progress and "hyperventilating" progressive science bloggers.

July 25, 2012, 1:25 pm
‘Unprecedented’ Greenland Surface Melt – Every 150 Years?
By ANDREW C. REVKIN

The flow of news releases and background science content from NASA is generally excellent, but the space agency badly blew it earlier this week with this headline, which has now reverberated around the Web: "Satellites See Unprecedented Greenland Ice Sheet Surface Melt."

Unprecedented means "never done or known before." Yet the news release beneath the headline directly undercuts that description of this melting event, saying that it is rare -- the last wide surface melt was in 1889, recorded in separate ice cores at the Greenland ice-sheet summit and in the northwestern part of the vast frozen expanse -- and has happened roughly every 150 years over a long stretch of centuries, as recorded deeper in the ice. (Here's a figure from a 1994 Science paper pointing to a series of such melt layers, reflecting summer warmth. Please see the postscript below for the key reference, provided by Lora Koenig of NASA.)

The inaccurate headline and burst of hyperventilating coverage and commentary (with some exceptions, like this new post by Climate Central) have already provided fodder for those whose passion or job is largely aimed at spreading doubt about science pointing to consequential greenhouse-driven warming.

This is unfortunate because the NASA release otherwise provided a fascinating, timely description of an unusual event, along with the historical context, as in this line:

    "Ice cores from Summit show that melting events of this type occur about once every 150 years on average. With the last one happening in 1889, this event is right on time," says Lora Koenig, a Goddard glaciologist and a member of the research team analyzing the satellite data. "But if we continue to observe melting events like this in upcoming years, it will be worrisome."

But subtlety and reality don't play well in some circles. Koenig's careful description of the science and the uncertainty about what the future holds prompted a public spanking from the Center for American Progress climate blogger Joe Romm, who charged her with "scientific reticence" -- alluding to NASA scientist James Hansen's paper criticizing sea-level researchers for being overly cautious in 2007 conclusions about the possible rate of sea rise in this century. (At the time, scientists focused on ice sheets and sea level pushed back on Hansen's complaints.)

The problem for Revkin is that Romm was correct. NASA was reluctant to tie the melt event to climate change, most likely for political purposes. The usual climate change denial bloggers jumped on Revkin's story and slammed "climate alarmists". Of course, none of these attackers went back and reviewed the original figures and sources.

Here's how an obscure, relatively coherent, but dead wrong, conservative blogger responded to the mangled science reporting. I cite this right wing blog post because it is a rational response to NASA's and the Times' misleading reports.

Skeptics put the freeze on NASA ‘hot air’ about Greenland ice
by Heidi

FoxNews

NASA’s claim that Greenland is experiencing “unprecedented” melting is nothing but a bunch of hot air, according to scientists who say the country’s ice sheets melt with some regularity.

A heat dome over the icy country melted a whopping 97 percent of Greenland’s ice sheet in mid-July, NASA said, calling it yet more evidence of the effect man is having on the planet.

But the unusual-seeming event had nothing to do with hot air, according to glaciologists. It was actually to be expected.

“Ice cores from Summit station [Greenland’s coldest and highest] show that melting events of this type occur about once every 150 years on average. With the last one happening in 1889, this event is right on time,” said Lora Koenig, a Goddard glaciologist and a member of the research team analyzing the satellite data.

Joe Romm then proceeded to hand Revkin his backside with a strong assist from NASA climatologist Gavin Schmidt.
And yet Dr. Jason Box, a leading Greenland expert with “19 expeditions to Greenland since 1994, more than 1 year camping on the inland ice,” used the following headline on his blog, Meltfactor.org, “Greenland ice sheet record surface melting underway.” Hard for something to be a record if it isn’t unprecedented.

The most thorough response comes from NASA’s own Gavin Schmidt in a comment posted on the NY Times story (one he confirmed with me):

    The NASA results are clearly unprecedented in the satellite record (and this is obviously what was being referred to), and come at the tail end of a strong increasing trend in summer surface melt area (as seen in data from the Steffen and Tedesco groups).

    However, we know Greenland was warmer than today at many intervals in the past – the Early Holocene (from isotopes and borehole temperatures), the last interglacial, the Pliocene etc. so there is no claim that this is something that has never happened in the history of the planet.

    Furthermore, the ‘every 150 years’ quote is very strange. The data on Summit melt layers – (discussed in the paper you reference http://www.igsoc.org/... ) and more easily visible here:http://www.gisp2.sr.unh.edu/... – indicates that the [1889] event was actually the only event in the last ~700 years, and there have only been 6 in the last 2000 years (4 of which were associated with the Medieval Climate Anomaly btw 750 and 1200AD). Hardly a frequently recurring ‘cycle’!

    The all-Holocene average that Koenig is referring to includes the warmer Early Holocene where orbital variability was driving warmer northern high latitude summers — and which is not relevant to the expected frequency in today’s climate.

That's right. There was one melt event in the past 700 years.  There were only 6 in the past 2000. Four of those 6 event happened in the 450 year long Medieval Climate Anomaly aka the medieval warm period. There is no 150 year cycle of melt events. This summer's melt was exceptional. It is not just a freak weather event because it is part of a decade of very rapid warming across the Arctic.

Greenland Mega-Melt Smashes Records, Temps Likely Warmest in 1000 Years

$
0
0

Far more ice has melted on Greenland's this year than before in the history of melt measurements. Measuring the amount of melting precisely is challenging, but scientists studying Greenland have found that they can make a good first estimate by adding up the amount of area melted each day of the melt season. This year, the season has been longer than ever to date and a larger area has melted per day. With weeks to go in the melt season, all previous melt records have been smashed.

Standardized melting index (SMI) for the period 1979 - 2012. the years between 1979 and 2011 use the full length season (May through September) where 2012 uses only the available period May through August 8th. Note that 2012 value is much higher than any of the previous years, despite the shorter period.
The melting index is computed from passive microwave satellite measurements and it can be seen as a measure of the ‘strength’ of the melting season: the higher the index the more melting occurred.  With more melting yet to come during August, 2012 will position itself way above the old records, likely becoming the 'Goliath' of the melting years during the satellite record (1979 - to date).  From the map below, we see that the cumulative melting index record is due to extensive increased melting occurring all over Greenland, especially at high elevations where melting lasted up to 50-60 days longer than the average. This means that some of the areas at high elevations in south Greenland are generally subject to a few days of melting (if it happens at all) and this year they underwent melting for more than 2 months (so far).
Map of the 2012 anomaly of the number of melting days with respect to the 1980 - 1999 average (e.g., red color indicates areas where melting lasted up to 50 days above the 1980 - 1999 mean). Updated through August 8th.
So, how is this record different from the one that happened in mid July of 2012 and received so much coverage ?

The extreme melting detected at high elevations in mid July (covering ~ 97 % of the Greenland ice sheet, see image on the left) generated liquid water that refroze after a few days, changing the physical properties of the snowpack but very likely not contributing to the meltwater that run offs from the ice and can potentially contribute to sea level rise. The event was exceptional in the sense that it is a rare event (imagine a postcard of Rio de Janeiro under a thin layer of snow !) but it happened in the past, according to the research of colleagues from the Dartmouth College at Summit. The record set by the overall melting has implications on the meltwater that goes into the ocean and it can impact ice dynamics, through basal lubrication or through its impact on the subglacial and englacial drainage systems. Also, the increased melting at higher elevations might remove the seasonal snow and expose more bare ice. The removal of bare ice (which is darker and the absorb more solar radiation and it is therefore more prone to melting than snow), is actually contributing to the net mass loss of Greenland.

Store Glacier, West Greenland  A 2010 NASA funded study found that the Greenland and Antarctic ice sheets are losing mass at an accelerating pace, three times faster than that of mountain glaciers and ice caps.
West Greenland has seen massive ice loss. This NASA photo shows the leading margin of the Store Glacier in west Greenland collapsing into the Labrador Sea.

This year's mega-melt is not caused by one freak summer of warm weather. Summer temperatures above the ice sheet began rising rapidly after the super El Nino of 1997-1998. Temperatures rose about 1° C from 1998 to 2011. Final numbers aren't in yet for 2012 but it's clear from weather instruments and melt data that this summer is even warmer.  The warm temperatures over the ice cap correlate with warm sea surface temperatures in the seas around Greenland. Warm Atlantic ocean water has been expanding northward into the Labrador and Greenland seas since 1998. The heat content of the north Atlantic ocean has risen the fastest of all the ocean basins on earth since 1998. This rapidly rising heat content is changing northern hemisphere weather and rapidly increasing the air temperatures over Greenland.

Greenland ice sheet summer surface air temperatures: 1840-2011

Developing a new manuscript (Box et al. submitted), I’ve managed to update the Box et al. (2009) near-surface air temperature reconstruction and am struck after incorporating 4 more years, it seems little doubt that recent summer air temperatures for Greenland ice are the highest in at least 172 years. Summer temperatures in the late 2000s are roughly 0.5 C warmer than in the 1930s and even warmer than at any time since at least 1840s. Because the reconstruction captures the end of the Little Ice Age, it is further reasonable to think that Greenland probably hasn’t been as warm in summer than since the time the Norse colonized Greenland beginning in 982. Implications for the recent warmth are of course grabbing headlines. I’ll be adding 2012 data soon.

The high temperatures this summer, likely the warmest in 1000 years, caused multiple episodes of large-scale melting this year.The episode that triggered melt over 97% of Greenland's surface was one of 4 episodes this summer where melting caused Greenland's reflectivity to drop to very low levels. A dome of warm air, likely related to the warm seas around Greenland, covered Greenland much of the summer.
This pattern of warm air doming in summer has been unusually prevalent over the past decade. Greenhouse gases released by human activities have caused the greatest warming in the Arctic and at high elevations. Greenland, which has both these factors, is warming very rapidly and is very vulnerable to increasing greenhouse gas levels.
lowest albedo since year 1150?

The 16 July low was the lowest in the satellite observational record and coincided with 97% of the ice sheet surface area melting. Previous maximum melt extent values since 1978 (when satellite obseravations begin, this is what NASA meant by “unprecedented”) are under 60% of the ice sheet area. Because the 2012 summer temperature was warmer than previous years (as I tweeted 5 August: June 2012, warmest on record for Greenland’s capital Nuuk since at least 1866 when continuous record keeping began, +7.2 C vs +4.3 C average), warmer than 1929 by at least 0.5 deg. C, and if the near surface air temperature records, continuous since 1840, are any indication (Box et al. 2009) this albedo anomaly and accompanying melt extent is probably without precedent since the Medieval Warm Period when the Norse settled Greenland.  Greenland temperature variability is high and there is evidence during the late Medieval Warm Period of a warm period in year 1150, that is 862 years before present (Kobashi et al. 2011). Other factors than warming that could have temporarily lowered Greenland ice reflectivity include the effect of major volcanic eruptions or wild fires. The latter I speculated here. The former has a noteworthy cooling effect but could conceivably still blanket the ice sheet with low reflectivity soot.

Climate SOS! Witnessing the Outer Banks Drown & Drawing the Line at 20ft Sea Level Rise

$
0
0

At the height of hurricane season in September I join the annual migration of a group of surfers to Cape Hatteras to catch the swells. One of the popular, well known surf spots we go is named S Turns, after the bends in the road, located at the northern end of Rodanthe. Over the past 7 years I have body surfed where the ocean has been progressively overtaking exclusive beach front cottages and causing the road to be rebuilt. The most famous of these cottages is the "Serendipity"  house which was featured in the movie "Nights in Rodanthe". Before the owners moved it off the beach, I used the house for shade when I needed a break from the surf and sun.

All barrier islands are inherently unstable. They respond to shifting currents, storms and the build up and transport of sand and fine sediment. Human actions, such as dredging and jetty construction, to stabilize barrier islands can unintentionally lead to sand starvation and increased erosion rates. Hurricanes are frequently blamed for damaging the islands, but storm driven overwash actually built the chain of islands and inlets served as pressure valves to let storm water out.

Last year we surfed to the north at Nags Head after Hurricane Irene's storm surge smashed Rodanthe and two new inlets cut off the road.


Hurricane damage can be repaired. Gaps can be filled and bridges built. We are planning to meet again this September near Hatteras.
~~~

NC DOT closing the inlet formed at S-Turns, north of Rodanthe

Western Carolina Univ. air photo of north Rodanthe taken after hurricane Irene

Sea level rise, however, is like an ongoing tsunami. It keeps on coming. It's more relentless than a honey badger that's found a new hive. It is eating up Pea Island year after year, storm after storm. The most destructive force to barrier islands is rising sea level. The Outer Banks don't stand a chance against rising seas driven by the melting of glaciers and thermal expansion of the ocean caused by a rapidly warming climate. Pea Island is one big storm away from oblivion.

Ultimately, rising sea level will overrun all barrier islands from the Jersey shore to Miami Beach from Florida's pristine Gulf shores to south Padre Island on the Texas Gulf Coast. Sea level rise of about 20 feet will happen over the next 500 years or so (a rate of a meter per century) if we meet the goal of limiting global warming to an average of 2°C (3.6°F). If we fail to slash emissions and trigger multiple warming feedbacks sea level rise could be much faster higher.It happened in the last interglacial, the Eemian period, 125,000 years ago. The study of corals around the world has confirmed what I saw when I was bodysurfing on the west side of Kauai. I saw beach sands at an elevation of about 20 feet at the base of lava rock cliffs above the town of Waimea, where Captain Cook discovered Hawaii. Those sands are the remnants of beaches from the last high stand of the Pacific ocean. Uranium dating methods applied to corals around the world now found at about 20 feet above sea level reveal that these corals are of Eemian age - 125,000 years old.

These data indicate that global (eustatic) sea level peaked 5.5 to 9 meters above present sea level, requiring smaller ice sheets in both Greenland and Antarctica relative to today and indicating strong sea-level sensitivity to small changes in radiative forcing.
Much of Florida will be submerged. Southern Louisiana will be overtaken by the sea and New Orleans will be lost to the storm surges and tides. Virginia Beach and the Outer Banks will drown. This is the best case scenario environmentalists are working hard to achieve.
~~~

Map of buried inlets of the Outer Banks showing the Eeemian shoreline in brown
Under best case emissions scenarios sea level will rise to the green/brown boundary.

Billions and billions of dollars of damage will happen to major port cities as sea level rises. We aren't going to stop it. I can see it happening every year I go back to Hatteras.

During the last interglacial period, ~125,000 years ago, sea level was at least several meters higher than at present, with substantial variability observed for peak sea level at geographically diverse sites. Speculation that the West Antarctic ice sheet collapsed during the last interglacial period has drawn particular interest to understanding climate and ice-sheet dynamics during this time interval. We provide an internally consistent database of coral U-Th ages to assess last interglacial sea-level observations in the context of isostatic modeling and stratigraphic evidence. These data indicate that global (eustatic) sea level peaked 5.5 to 9 meters above present sea level, requiring smaller ice sheets in both Greenland and Antarctica relative to today and indicating strong sea-level sensitivity to small changes in radiative forcing.
Fortunately, the estimated rate of about 4 feet of sea level rise in one hundred years is slow enough that society can respond. Places such as Virginia Beach and Rodanthe will see the effects first because they are in sea level rise and erosion hotspots. We can live with 20 feet of sea level rise over 500 years. It's shocking to think of what will be lost, but it's a long way into the future. If we let global temperature increases go higher than 2°C we will have problems with America's food supply in the next 50 years. The present drought conditions may become the new normal in decades. And then things will get worse.

I am fighting to stop the unfathomably catastrophic consequences of exceeding 2°C. I am fighting to save the Amazon rain forest from going up in smoke and turning into savannah. I'm fighting to save the farms and vineyards of southern Europe from resembling north Africa. I am fighting to save the breadbasket of America from climate change that will make it resemble Amarillo Texas.  We cannot quit, we cannot lose hope because our grandchildren would be left a Road Warrior world.

Climate models run by NCAR's Aguio Dai confirm earlier studies that show the catastrophic drying of America's bread basket under high emissions scenarios. Famine and global conflict will be the inevitable consequence of allowing greenhouse gas emissions to continue to grow. Last years drought in Texas and Mexico and this years drought in the midcontinent are the start of this process of warming and drying that we must stop.

Source: PUBLISHED ONLINE: 5 AUGUST 2012 | DOI: 10.1038/NCLIMATE1633 Increasing drought under global warming in observations and models Aiguo Dai News summary of article and figure source link here.

eSci: Arctic Glow-in-the-Dark Clouds Spreading South Linked to Increasing Methane

$
0
0

Pearlescent blue clouds mysteriously appeared in far northern latitudes after the eruption of Krakatoa in Indonesia. Perhaps these noctilucent clouds existed before the massive eruption threw enormous quantities of sulfurous vapors into the stratosphere. Perhaps the bright sunsets that attracted millions of eyes resulted in the wispy ultra high clouds finally being noticed. Perhaps. But why then are these strange clouds spreading south? Why are clouds once seen only in places far to the north such as Norway and Finland now being seen as far south as Colorado?

On June 13, 2012, when this image was taken from the space station as it passed over the Tibetan Plateau, polar mesospheric clouds were also visible to aircraft flying over Canada. In addition to the still image above, the station crew took a time-lapse image sequence of polar mesospheric clouds several days earlier on June 5, while passing over western Asia. It is first such sequence of images of the phenomena taken from orbit.

Polar mesospheric clouds form between 47 to 53 miles (76 to 85 kilometers) above Earth’s surface when there is sufficient water vapor at these high altitudes to freeze into ice crystals. The clouds are illuminated by the sun when it is just below the visible horizon, lending them their night-shining properties. In addition to the polar mesospheric clouds trending across the center of the image, lower layers of the atmosphere are also illuminated. The lowest layer of the atmosphere visible in this image--the stratosphere--is indicated by dim orange and red tones near the horizon.

Electric blue clouds, literally at the edge of space, have been recently seen glowing in the dark from Oregon to Colorado to Virginia, further south than they have ever been seen.  Until the last several decades they were always seen north of 50 N Latitude. No one is sure why the clouds are moving south but global warming is a suspected cause.

Image Hosted by ImageShack.us
Image created by NASA

Noctilucent clouds form at exceedingly cold temperatures around negative 125 Celsius, 50 to 100km (30 to 60 miles) above the earth's surface, in the mesosphere. The atmosphere is one hundred million times drier than the Sahara desert, but clouds form because the temperature is so low. They are seen in midsummer when the moisture from the stratosphere (the layer below the mesosphere) is known to upwell into the mesosphere. One other likely source of water is upwelling methane gas. Methane is broken down by UV and high energy radiation to generate hydrogen gas which reacts with oxygen to form water. Material from incoming meteors may also add both tiny particles needed to seed the clouds and ice particles which vaporize. Powerful volcanic eruptions may also add particles that nucleate ice.

Image Hosted by ImageShack.us
Noctilucent clouds over Portland by VictorVonSalsa Portland, Oregon 15July09

Less venting of natural gas from oil wells led to slowing of the growth rate of atmospheric methane from 1985 to 2007. The perfect match of methane levels to ethane levels during that period is the clue that ties the decline to oil and gas production activities. Natural processes do not release methane and ethane in tandem as oil and gas production does. In 2007 Arctic sea ice suffered a catastrophic decline and increases in Arctic methane levels were observed.

Graph showing decline in growth of methane and ethane were in synch through 2007 - tied to less flaring and release of natural gas. After 2007, when Arctic sea ice collapsed, methane increases while ethane declines.
Sea ice extent and area declined catastrophically in 2007. Since that sudden decline increasing levels of methane have been observed in the atmosphere above the Arctic ocean. Permafrost has also melted in increasing quantities with the warming of the Arctic and the melting of the sea ice. The loss of ice greatly darkens the Arctic and amplifies the warming. There are many agricultural sources of methane but none of them suddenly changed in 2007. The sudden change in methane/ethane in 2007 correlates directly with the loss of sea ice.
Natural processes work to remove methane in the tropics and warm temperate areas. Those processes are not active in the polar regions. Thus methane in the rises up in the lower atmosphere because it is very light and becomes more concentrated as it rises up in the Arctic than in the tropics. This figure shows the growth of methane in the lower atmosphere from 2008 to 2011. Some of this methane rises to the middle and upper layers of the atmosphere.
Extremely low temperatures at the top of the lower atmosphere trap water vapor that rises up in the form of icy cirrus clouds, so the stratosphere is extremely dry. Methane, however, passes through the cold trap into the stratosphere. When it reaches the upper atmosphere, it is oxidized by energetic particles and oxygen to CO2 plus water. Meteors burning up in the upper atmosphere creates a very thin smoke. The water may then freeze onto fine particulates formed from meteor smoke to create noctilucent clouds if the conditions are right.

eSci: "Planetary Emergency" New 2012 Arctic Sea Ice Record 18% Below 2007 Low

$
0
0

Arctic sea ice extent bottomed out at 3.41 million square kilometers (1.32 million square miles) on September 16, smashing the old record minimum of 4.17 million square kilometers (1.61 million square miles) set on September 18, 2007, according to the NSIDC. The 2007 record was set under ideal sunny and warm conditions for melting, but this summer's weather was only average for melting. The record collapse in sea ice extent happened this year because ice was very thin before the melt season began. Thick multi-year old sea ice is almost gone from the Arctic. The vast extent of open water this summer has allowed the Arctic ocean to adsorb large amounts of solar heat so ice thickness will not recover much this winter. Arctic sea ice is in a death spiral. One expert predicts that the Arctic ocean will be ice free in September 2015 or 2016.

NASA's Dr James Hansen, concerned about the destabilization of the climate and the triggering of additional feedback loops - such as large scale seabed methane release - by the loss of Arctic sea ice, declared a planetary emergency at a press conference held by Greenpeace.

“We are in a planetary emergency,” said Hansen, decrying “the gap between what is understood by scientific community and what is known by the public.”
NASA image showing September 16, 2012 record annual minimum NSIDC sea ice extent vs. 30 year average annual sea minimum ice extent. Sea ice extent maps are derived from data captured by the Scanning Multichannel Microwave Radiometer aboard NASA's Nimbus-7 satellite and the Special Sensor Microwave Imager on multiple satellites from the Defense Meteorological Satellite Program. Credit: NASA/Goddard Scientific Visualization Studio

Arctic Sea Ice Loss is Affecting Northern Hemisphere Weather

The long term decline in sea ice is affecting northern hemisphere atmospheric circulation patterns. One part of the Arctic ocean, the Barents Sea, has become increasingly ice free year round. This ice free area is a northern extension of warm Atlantic ocean water into the Arctic. Increased storminess has been observed in this region. The storms transfer large amounts of heat from the ocean to the Arctic atmosphere, often creating large warm bubbles of air called blocking highs. This summer, a warm blocking high led to the stunning event in Greenland where 97% of the surface of Greenland's ice cap melted. Blocking highs can divert cold air south into western Europe or eastern north America. Thus, the loss of sea ice is destabilizing the northern hemisphere's weather patterns.

An increasing area of the Arctic's Barents Sea has become ice free year round. This has allowed warm Atlantic ocean water to expand into the Arctic, releasing heat and changing northern hemisphere weather patterns.
The Barents sea has been stormy and Greenland has been frequently covered by a blocking high for 90 days of summer 2012. The effects of blocking highs over Greenland can be even more dramatic in winter, sending cold air and snow storms into the eastern U.S. while warming Greenland and the Arctic.
The long-term predictions of sea ice area and extent made by the IPCC in 2007 were wildly optimistic compared to the observations of the past 5 years. Because ice acts as a reflective mirror, the loss of sea ice has a large positive feedback effect on Arctic and global warming. Open water takes up heat that ice formerly reflected back to space. Therefore the IPCC's predictions made in 2007 have seriously underestimated the severity of the rate and amount of Arctic and global warming.

IPCC Models Failed to Predict Rapid Sea Ice Extent Decline

IPCC 2007 models failed to predict rapid sea ice decline.
However, the rapid decline of sea ice is fit by a simple exponential model applied to sea ice volume. The volume at the beginning on September 6, likely just before the minimum volume was reached, was well predicted by this empirical fit. If this fit continues to be predictive, sea ice volume will decline to zero in September 2015. Critics may rightly say that this fit is not based on physical theory. That may be true, but the complex models used by the IPCC clearly failed to incorporate a key physical process, so they are useless for prediction until the are corrected.
Will the loss of sea ice trigger increased methane emissions in the Arctic Ocean?

Disturbing reports of increasing methane levels in the Arctic ocean have been made by scientists for the past several years. No one knows how the warming sea waters will affect methane emissions from the shallow Siberian shelf where vast deposits of methane ice (known as clathrate) are located. Scientists have proposed very different models of Arctic seabed clathrate stability. Real Climate's David Archer summarized the position that CO2, not methane, is the primary climate change concern. Heat flow in undisturbed subsea sediments is very slow, so slow that it takes thousands of years for a heat pulse to affect buried clathrates.

What could happen to methane in the Arctic?

The methane bubbles coming from the Siberian shelf are part of a system that takes centuries to respond to changes in temperature. The methane from the Arctic lakes is also potentially part of a new, enhanced, chronic methane release to the atmosphere. Neither of them could release a catastrophic amount of methane (hundreds of Gtons) within a short time frame (a few years or less). There isn’t some huge bubble of methane waiting to erupt as soon as its roof melts.

And so far, the sources of methane from high latitudes are small, relative to the big player, which is wetlands in warmer climes. It is very difficult to know whether the bubbles are a brand-new methane source caused by global warming, or a response to warming that has happened over the past 100 years, or whether plumes like this happen all the time. In any event, it doesn’t matter very much unless they get 10 or 100 times larger, because high-latitude sources are small compared to the tropics.

The opposing point of view is that there are vertical pathways for methane release, heat transfer and fluid convection called taliks disrupting the undersea permafrost of the Siberian shelf. Destabilization of taliks could trigger rapid release of massive quantities of methane, according to some scientists.
Since the area of geological disjunctives (fault zones, tectonically and seismically active areas) within the Siberian Arctic shelf composes not less than 1-2% of the total area and area of open taliks (area of melt through permafrost), acting as a pathway for methane escape within the Siberian Arctic shelf reaches up to 5-10% of the total area, we consider release of up to 50 Gt of predicted amount of hydrate storage as highly possible for abrupt release at any time. That may cause ∼12-times increase of modern atmospheric methane burden with consequent catastrophic greenhouse warming.
A recent ship report of methane emissions observed in the Laptev sea by Russian scientists needs to be put in context, written up and peer reviewed. At this point we don't know enough to know what it means.
According to the press-service of the expedition aboard The Viktor Buinitsky research vessel, the diameter of some of the ‘methane fields’ found in the northern part of the Laptev Sea exceeds 1 kilometre.

Updated: Hurricane Sandy likely to hit mid Atlantic - could be "Perfect Storm"

$
0
0

NHC's 5pm forecast brings Sandy into the Jersey shore Tuesday morning then inland to Pennsylvania by Tuesday evening. Sandy's strongest winds, storm surge and waves could affect highly populated northern New Jersey and New York City. The full moon and high tides will increase impacts to New York harbor, beaches and coastal communities.

5pmHurricane Sandy forecast 25Oct12
The NHC forecasts hurricane Sandy to landfall on the U.S. east coast in 120 hours.
Hurricane Sandy maintained most of its integrity and strength while passing over Cuba and is about to strike the south central Bahama Islands with 105 mile per hour (about 90 knots) sustained winds. Winds aloft continue to be very strong - 126 knots at about 10,000 feet - but the low level circulation and eye were disrupted by Cuba's high terrain.  microwave and visible imagery shows that the eye reforming over the warm waters between Cuba and the Bahamas.
Both the intensity and track forecasts are problematic. A large wave in the upper atmosphere over the continental U.S. has started to interact with Sandy. The models that forecasters use to predict both the track and intensities of hurricanes have been in consistent disagreement for several days. The reliable European ECMWF model has consistently tracked Sandy towards the mid-Atlantic states and maintained Sandy as a very intense storm. The good GFDL (Geophysical fluid dynamics lab) model has aligned with the ECMWF forecast for the past 2 days. This morning, the HWRF model finally fell in line with the mid-Atlantic landfall prediction. The general agreement of these 3 models forced the NHC to adjust its forecast westward towards New Jersey in 5 days.

The hurricane center is forecasting shear to weaken Sandy but so far Sandy has been insensitive to 20 knots of shear. That's probably because the shear isn't reaching Sandy's core. The upper winds around Sandy are spreading apart - they are highly difluent - and the shear calculations don't account for this difluence. These interactions with an upper atmospheric wave give Sandy some frontal characteristics. Sandy is no longer a "pure" tropical storm.

Professor Robert Hart of Florida State University has developed a way to analyze hybrid storms that have both tropical and frontal characteristics. His model shows Sandy becoming a deep hybrid low as it moves north of the Bahamas tomorrow. It will become like Hurricane Irene, a deep low with a broad wind field and a large storm surge according to multiple FSU model runs. The latest GFDL model analysis shows a broad deep low, a perfect storm, landfalling near Delaware Bay. The National Hurricane Center is forecasting just below hurricane strength winds as Sandy approaches shore, but because Sandy will likely be a very large storm with deep low pressure and a large storm surge, it will likely cause far more damage than a pure tropical category 1 hurricane.

Sandy is a potential billion dollar storm if it makes landfall on the mid-Atlantic (or New York City & Long Island).
The mid-Atlantic U.S. scenario
Landfall Monday along the mid-Atlantic coast on Monday, as predicted by the ECMWF and NOGAPS models, would likely be a billion-dollar disaster. In this scenario, Sandy would be able to bring sustained winds near hurricane force over a wide stretch of heavily populated coast, causing massive power outages, as trees still in leaf fall and take out power lines. Sandy is expected to have tropical storm-force winds that extend out more than 300 miles from the center, which will drive a much larger storm surge than its winds would ordinarily suggest. The full moon is on Monday, which means astronomical tides will be at their peak for the month, increasing potential storm surge flooding. Fresh water flooding from heavy rains would also be a huge concern. Given the ECMWF's consistent handling of Sandy, I believe this mid-Atlantic scenario has a higher probability of occurring than the Northeast U.S. scenario. However, it is likely that the models are overdoing the strength of Sandy at landfall. The models have trouble handling the transition from tropical storm to extratropical storm in these type of situations, and I expect that the 940 mb central pressure of Sandy predicted at landfall Monday in Delaware by the ECMWF model is substantially overdone.
This storm scenario reminds me of the typhoon systems that turn extratropical in fall over the Pacific Ocean, delivering massive swells to the Hawaiian Islands. As the hurricane season extends later into the fall in the Atlantic, as it appears to be doing according to a recent post by Jeff Masters, we can expect to see an increase in "perfect storms" affecting the east coast of North America. This is an unprecedented third year in a row with 19 named storms.  The Atlantic waters on the east coast of the U.S. and Canada have been at record levels this summer and fall. This record ocean heat sets the scene for a perfect storm.
Multiple models predict Sandy will be a "perfect (hybrid) storm" to hit the east coast early next week.
Update
Note the large "blocking high pressure" extending across the north Atlantic south of Greenland. This large dome of relatively warm air and high surface pressure will develop an east to west flow that will turn Sandy back towards the east coast. This is from the midday 12Z run of the GFS model today, Oct, 25.
Sandy 120 hour GFS forecast 12zOct25 2012

Jump in Sea Level Slams U.S. East Coast

$
0
0

Hurricane Sandy and a series of noreasters have combined with an apparently unprecedented one year jump in sea level to cause a wave of destruction on the U.S. east coast. The one year change of the average sea level of the North Atlantic ocean from fall 2011 to fall 2012 is about 32mm which absolutely dwarfs the computed trend of 1.7 mm/year since 1992. The approximately 32mm jump is the largest in the satellite altimetry record which began in 1992. 32mm is 1 1/4 inches, not a huge absolute rise, but an unprecedented rise in just one year. These data have not yet been verified and published, they are "live" internet data from NOAA, but the numbers are consistent with other data I have reviewed including big jumps in measured sea levels from tide gauge data (which are highly variable depending on wind speed and direction). I read the numbers off the high resolution graph, so the 32mm value is not precise or verified, but I think it's in the ballpark.

North Atlantic sea level determined by NOAA from satellite altimetry.
Sea level of the north Atlantic jumped from 2011 to 2012 at an apparently unprecedented rate.
Sea surface height anomaly maps determined by satellite altimetry show that there was  a large positive sea level height anomaly off of the east coast on October 26, 2012 before hurricane Sandy hit. Note that this figure is consistent with reports that the U.S. east coast is a hotspot of sea level rise. The northward expansion of the Atlantic warm pool, pushing the Gulf Stream towards Long Island and southern New England, is apparent in the large anomalies offshore, south of New England. These hot spot anomalies of greater than 25 cm ( about 10 inches ) are what made sea level rise a significant factor in the damage to the east coast. The anomalies off of the mid-Atlantic states are about 8 times larger than the average sea level rise of the north Atlantic.
North Atlantic sea level anomaly by AVISO satellite altimetry
There was a large sea level anomaly off of the east coast before hurricane Sandy hit.
Hurricane Sandy's surge and swells damaged North Carolina's outer banks, cutting off roads to Hatteras Island. Ongoing higher than normal tides have increased the damage to the Outer Banks since Sandy hit. Tides a foot or more above normal have hit the east coast from Miami Beach, to Cape Hatteras to New York obstructing efforts to repair damage from Sandy.
Hatteras tides
Tides have been very high at Cape Hatteras this fall. Onshore winds, driven by a series of noreasters, have combined with a jump in the sea level of the North Atlantic to push water levels to a foot above normal for extended periods of time.
A large change in the winter north Atlantic atmospheric circulation pattern from 2010 to 2012 was one factor that drove the jump in sea level. The North Atlantic Oscillation (NAO) shifted from strongly negative in 2010 to strongly positive in 2012. In years with a negative NAO weaker winds drive less water from the south Atlantic into the North Atlantic. In positive NAO years more water is transported into the North Atlantic, raising sea levels. The shift from strong negative to strong positive NAO had a major role in the sea level jump, but further investigations will be needed to understand why the jump was so large. The extreme La Nina of 2010 also played a role. There was so much anomalous rain over the continents in 2010 that global sea levels dropped briefly. There may be other important factors contributing to the jump in sea level.
January February March North Atlantic Oscillation 1950 - 2012
The winter (JFM) North Atlantic Oscillation shifted from strongly negative in 2010 to strongly positive in 2012.
A recent research report by Stefan Rahmstorf, Grant Foster and Anny Cazenave using satellite altimetry found that global sea level is rising 60% faster than IPCC forecasts. However, detailed analysis of satellite altimetry maps shows hotspots in the western Pacific, southern Indian ocean and western North Atlantic where sea level rise is taking place at a much higher than average rate. The coastline from Cape Hatteras to Cape Cod, where this fall's intense storm damage occurred is a sea level rise hot spot. Sea level rise made the damage significantly worse.
Global sea level rise exceeds IPCC predictions by 60%
Global sea level rise exceeds IPCC predictions by 60%.
Sea level measured by satellite altimeter (red with linear trend line; AVISO data from (Centre National d'Etudes Spatiales) and reconstructed from tide gauges (orange, monthly data from Church and White (2011)). Tide gauge data were aligned to give the same mean during 1993–2010 as the altimeter data. The scenarios of the IPCC are again shown in blue (third assessment) and green (fourth assessment); the former have been published starting in the year 1990 and the latter from 2000.

Global sea level rise is very uneven. Grant Foster, a co-author of the sea level rise paper explained in his blog that sea level rise is much faster in some locations than others.

Sea level is by no means “level.” Not only are there small changes in the geoid (the gravitational equipotential surface), the sea itself does not conform to the geoid because of winds and currents, tides and storms. These geographical variations are in addition to the constant fluctuations caused by the exchange of water between land, oceans, ice, and atmosphere, and of course the changes wrought by global warming.
AVISO's most recent map of sea height anomalies shows that the east coast is one of the word's regions most highly impacted by sea level rise at this moment.
Global ocean height anomalies, by AVISO
The U.S. east coast is a global sea level rise hot spot.
Videos after the burnt orange croissant:

Unprecedented Arctic Ice Loss in 2012 & Video "Like watching Manhattan break up"

$
0
0

2012 was a year of unprecedented melting across the Arctic. The Arctic is warming faster than any other region on earth and the consequences are shocking. Sea ice area and volume plummeted to the lowest levels ever measured. Greenland suffered from record glacial melting and record heat. Figures show that the melting increased at a stunning rate in 2012. The Chasing Ice movie captured the catastrophic failure of a Manhattan sized mass of ice. The figures come alive in the movie.

The Arctic sea ice volume was at the record minimum for December 1. The weak annual rebound in ice volume this fall puts the Arctic on track for another record annual minimum next September. Note the baseline is zero.

Since the catastrophic summer of 2007 summer Arctic sea ice has gone into a death spiral. The September minimum level is rapidly approaching zero.
Arctic sea ice volume
The rate of melting of ice in glaciers across the Arctic has also been speeding up over the last decade. The summer of 2012 brought a spectacular record ice mass loss to Greenland.
The Chasing Ice trailer shows the beginning of the spectacular Manhattan island sized calving of the Illusiat glacier. Because this is the second massive calving in recent years, it is an unprecedented example of Arctic glacier retreat.

The Guardian's video shows the whole spectacular crack up compressed to under 4 minutes. The Guardian's videos are not embedding for me at DK.
Click to see the massive break up here.


Viewing all 81 articles
Browse latest View live


Latest Images